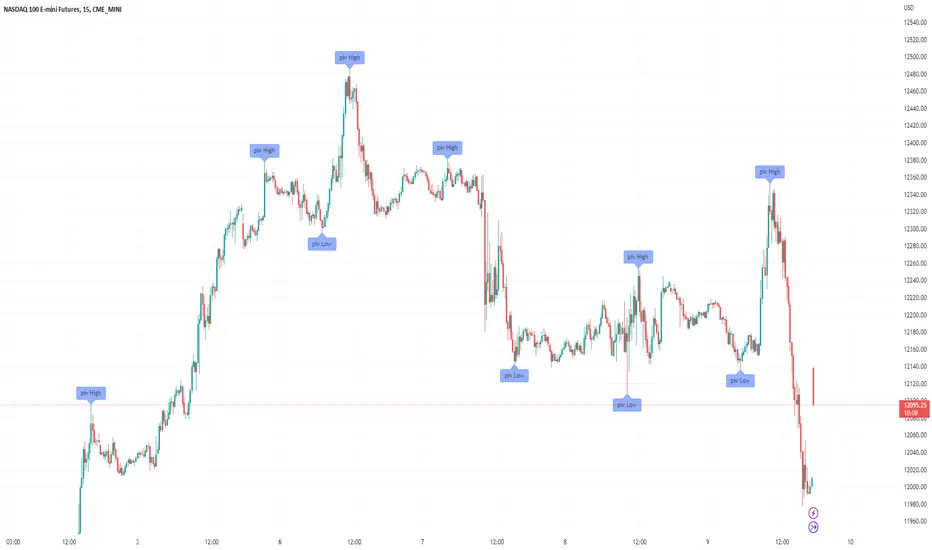
Filter-Out Weak Pivot highs/lows, Swing highs/lows: MethodJust a simple indicator for refining the standard method of finding Pivot highs & Lows; Allowing user to filter-out weak/flat/rounded Pivot highs/lows
-Aim of this is to get pivot highs & pivot lows coded to print more in line with what the eye would naturally be drawn to as an obvious pivot high/low.
-This uses local moving average around the pivot high/low together with user-input ATR multiple, to create a condition for filtering out lacklustre pivot highs/lows.
-Thought i'd publish this separately as a tool that other coders might find useful.
//inputs//
~adjust looback/lookforward for Pivot highs/lows
~adjust 'spikiness' index to filter out less impressive pivot highs/lows (higher number = more selective)
Tìm kiếm tập lệnh với "swing high"
Order Blocks & Breaker Blocks [LuxAlgo]The Order Blocks & Breaker Blocks indicator detects order blocks that can be turned into breaker blocks on the chart automatically once mitigated.
Users can determine the amount of bullish and bearish order/breaker blocks that display on their chart from within the settings menu.
🔶 SETTINGS
Swing Lookback: Lookback period used for the detection of the swing points used to create order blocks.
Show Last Bullish OB: Number of the most recent bullish order/breaker blocks to display on the chart.
Show Last Bearish OB: Number of the most recent bearish order/breaker blocks to display on the chart.
Use Candle Body: Allows users to use candle bodies as order block areas instead of the full candle range.
🔹 Style
Show Historical Polarity Changes: Allows users to see labels indicating where a swing high/low previously occurred within a breaker block.
🔶 USAGE
We have published several scripts covering the detection of order blocks previously, however, the concept of breaker blocks was not yet introduced.
When price mitigates an order block, a breaker block is confirmed. We can eventually expect price to trade back to this breaker block offering a new trade opportunity.
We can see that this is similar to a change in polarity, where a support becomes a resistance after a breakout and vice versa.
This script highlights regular order blocks as solid extended areas on the chart and breaker blocks as dashed lines with dual-colored areas. The color change and dashed line starts at the location where the order block was mitigated.
Using a higher "Swing Lookback" setting will return longer term order/breaker blocks on the chart.
Users can optionally enable "Historical Polarity Changes" labels within the settings menu to see where breaker blocks might have provided an effective trade setup previously.
The "Historical Polarity Changes" setting is disabled by default & is most effective using replay mode as the labels are backpainted.
The order blocks & breaker blocks themselves can be used in real-time as they are detected based on the swing length & previous breaker blocks being mitigated.

Swing Indicator (2 before, 1 after) v2 with Dong-DangFeatures
Detection Swing (swing HIGH is the highest bar among 2 bars before and 1 bar after, and swing LOW is the lowest bar among 2 bars before and 1 bar after)
Dong-Dang (The line plot switch between a swing HIGH and LOW ==> represents the price movement)
Fixes
fix swing detection from the last version when there are 2 or more bars that have the same high or low price
======== ======== ========
ฟีเจอร์
การจับสวิง (จะเป็นสวิง HIGH ก็ต่อเมื่อแท่งนั้นสูงกว่า 2 แท่งก่อนหน้า และ 1 แท่งด้านหลัง, และจะเป็นสวิง LOW ก็ต่อเมื่อแท่งนั้นต่ำกว่า 2 แท่งก่อนหน้า และ 1 แท่งด้านหลัง)
ด๊องแด๊ง (คือเส้นที่ลากสลับไปมาระหว่างสวิง High และ Low ==> ใช้เพื่อดูการเคลื่อนที่ของราคา)
สิ่งที่แก้ไข
แก้ไขการจับสวิงจากเวอร์ชันก่อนหน้า ในกรณีที่มีแท่งเทียน 2 แท่ง หรือมากกว่า มีค่า high หรือ low เท่ากัน
======== ======== ========
Credit: Bravo Trade Academy

Pivot TrackerThis script finds swing lows and swing highs based on input criteria for lookback and lookforward periods, and plots letters accordingly.
Helps identify trend or lacktherof
HH = higher high
LH = lower high
HL = higher low
LL = lower low

Bjorgum MTF MAScope:
Up to 3 MA's can be applied at the users discretion
Choose between 10 different average types including favorites from the Bjorgum series from HEMA to Reversal T3's
Each MA can be independently set
Go Multi-timeframe! Any MA can be set to any timeframe of reference you choose (ex. using 3 different timeframes of higher resolution to your chart reference to establish a multi-time frame trend)
RSI HEATMAP. Use the bar color or the MA color selection toggle to set your color to reference RSI on a gradient. This helps to establish clear visual reference to momentum on top of trend analysis
Assigning RSI bar color to an MA of a higher time frame can allow you to see visual reference of momentum of the greater trend that may be at play.
Example: trying to get short on a 15min while your 1hr and 4hr RSI Heatmap burns deep in oversold.
RSI color can be assigned to the bar color, the MA (1,2 or 3), or both. Alternatively, bar color can be assigned to a more simple rising/ falling MA color and price above/ below the MA for bar color.
ALL MTF FUNCTIONS ARE NON_REPAINTING.
The Idea
The original inspiration behind the script came from an observation of a constant struggle of Pinecoders of both youth or experience to find accurate multi-timeframe indicators that do not repaint, and appear as should on historical bars, while performing reliably in real time. I encourage you to scroll the Pinecoders FAQ on a recent piece explaining the difficulties and caveats of different approaches, but I would like to reference the elimination of the historical bar offset for THIS purpose. MA's are based on closing prices, that is to say they are confirmed and will not change once the bar has closed. There is no need to offset these for historical reference. The purpose of the historical offset is best exemplified, for example, with an intraday strategy involving daily breakouts. Let's entertain going long on a break to a new daily high. We would not know that in real time so we need to reference the previous bars close for BACKTESTING purposes, otherwise we get "lookahead bias". There is no shortage of strategies unintentionally employing this bias out there (I'm sure you have come across them with their unrealistic results).
There is no worry of repainting with the MTF security function included within this script, nor will it offset for something involving lookahead bias. I encourage those that are playing with the code or perhaps writing strategies of their own to borrow the functions within. There is also a function that will return the 10 MA variable selection - yours to keep.
With all that in mind, I wanted a practical script that is easily deployable in everyday trading for the average trader that gives the user a firm grip on their trading steering wheel equipped with the feel of the road. Incorporating several MA's of differing times with the RSI heatmap gives a good visual reference and feel to your trading environment, while offering a level of customization that will fit an individuals personal trading style. The RSI heatmap gradient is per percentage between 30 and 70 and your 2 colors - anything outside of those levels gives you the vibrant bias color
Below I walk through 2 examples of live trades scenarios I made using the mindset the script offers.
The Trade
LONG IZEA
Timeframe: 4hr chart
- 3 Tilson MA's of varying length are deployed at varying intraday time frames
- A bullish pattern in an uptrend offers a possible trade allowing entry from a low risk point from the pattern low
- See the chart for notes and observations using the script
- Notice how the heatmap brightens up as price extends far away from the averages - your risk has elevated for a new position
- Notice the heatmap cool off while price action consolidates sideways
The Trade
SHORT BTCUSDT
Timeframe: 4hr chart
- 3 EMAs are employed - same length (50), with 3 successive timeframe resolutions
- A downtrend is formed with a sharp move to stack the EMAs into layers
- A pull back opportunity presents itself in bearish consolidation
- Notice a Doji star at resistance establishing a swing high as RSI cools off into the EMA dynamic resistance for entry
- An '"equal legs" measured move can be used for a trade target with a stop out above the swing high.
- Again, take note of distance from EMA's, the heatmap in combination with trend development surrounding the MA's
These were just two ideas to show you an example of how to implement some strategy into your trading and to get some interesting use from the indicator. Hope you enjoyed the read and happy trading.

Trend Type Indicator by BobRivera990Usage:
The purpose of this indicator is to programmatically determine the type of price trend using technical analysis tools.
You can do a quick check on the asset’s higher and lower time frames. For example, if you are trading on an H1 chart, you can check the m5 chart to ensure that the trend is in the same direction and similarly check the H4 chart to ensure that the higher time frame price is also moving in the same direction.
If multiple time frame charts confirm a similar trend, then it is considered a very strong trend and ideal for Trend trading.
Remarks:
By default, the last status is related to 8 periods before the latest closing price.
Related definitions:
The three basic types of trends are up, down, and sideways.
1. Uptrend
An uptrend describes the price movement of a financial asset when the overall direction is upward. The uptrend is composed of higher swing lows and higher swing highs.
Some market participants ("long" trend traders) only choose to trade during uptrends.
2. Downtrend
A downtrend refers to the price action of a security that moves lower in price as it fluctuates over time.
The downtrend is composed of lower swing lows and lower swing highs.
3. Sideways
A sideways trend is the horizontal price movement that occurs when the forces of supply and demand are nearly equal. This typically occurs during a period of consolidation before the price continues a prior trend or reverses into a new trend.
How it works:
Step 1: Sideways Trend Detection
In this step we want to distinguish the sideways trend from uptrend and downtrend. For this purpose, we use two common technical analysis tools: ATR and ADX
1. Average True Range (ATR)
The average true range (ATR) is a technical analysis indicator that measures market volatility.
We also use a 20-period moving average of the ATR.
When the ATR is below the average of its last 20-periods, it means that the rate of price volatility has decreased and we conclude that the current trend is sideways
2. Average Directional Index (ADX)
The average directional index (ADX) is a technical analysis indicator used by some traders to determine the strength of a trend.
The trend has strength when ADX is above 25.
So when the ADX is less than or equal to 25, there is no strong trend, and we conclude that the current type of trend is sideways.
Step 2: Detect uptrend from downtrend
If it turns out that the current price trend is not sideways, then it is either uptrend or downtrend.
For this purpose, we use plus and minus directional Indicators (+ DI & -DI).
A general interpretation would be that during a strong trend, when +DI is higher than -DI, it is an uptrend. When -DI is higher than +DI, it is a downtrend.
Parameters:
"Use ATR …" ________________________// Use Average True Range (ATR) to detect Sideways Movements
"ATR Length"_______________________ // length of the Average True Range (ATR) used to detect Sideways Movements
"ATR Moving Average Type" ___________// Type of the moving average of the ATR used to detect Sideways Movements
"ATR MA Length" ____________________// length of the moving average of the ATR used to detect Sideways Movements
"Use ADX ..."_______________________ // Use Average Directional Index (ADX) to detect Sideways Movements
"ADX Smoothing”____________________// length of the Average Directional Index (ADX) used to detect Sideways Movements
"DI Length"_________________________// length of the Plus and Minus Directional Indicators (+DI & -DI) used to determine the direction of the trend
"ADX Limit" ________________________// A level of ADX used as the boundary between Trend Market and Sideways Market
"Smoothing Factor"__________________// Factor used for smoothing the oscillator
"Lag"______________________________// lag used to match indicator and chart
Resources:
www.investopedia.com

Carl's BOTTOM DETECTOR: Williams %R + normalized ATRThis script is based on Williams %r and normalized ATR.
When William%R indicates extreme oversold conditions
and the ATR indicates extreme volatility at the same time,
then it prints an arrow below the candle.
It is based on the concept that swing lows and market bottoms
are characterized by extreme oversold momentum and
extreme volatility.
The highest tf's like the daily, show you perfect market bottoms for btc.
If you zoom in it's still good to find swing highs and lows, if necessary
you can tweak the settings.
Next to that I added grey, red, and green vertical bands to the chart.
This is based on the VIX, the SPX volatility index.
Whenever the volatility of the S&P500 crosses above a specific level
it prints a colored background band behind the candle.
Grey means high volatility, red extreme volatility (like in the covid
crisis and 2008 crisis), and green means the same as grey, but indicates
it came after a red zone and could mean strong bullish bounce momentum.
You can tweak the thresholds for the grey/green and read areas.

Price Swing IndicatorThis indicator shows you the highs and lows of the previous "X" amount of bars. This is an objective way of identifying previous price swings. For example, an input of "10" will show you the Swing High (SH) of the previous 10 bars and the Swing Low (SL) of the previous 10 bars. The higher the number, the higher number of bars included in the calculation. Therefore, the higher the number, the less "noise" taken into consideration. This means that higher input values will not take into consideration smaller retracements. Lower input values will take into account small retracements within larger movements.

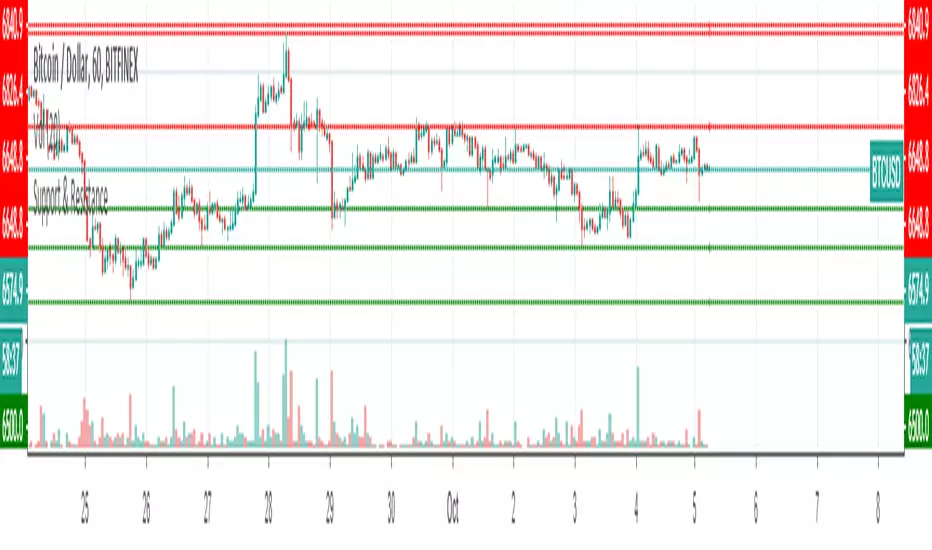
Support & ResistanceThis indicator detects large swings/pivots in historical price action to highlight tops and bottoms which might act as future levels of support or resistance. The code by default detects the last 3 significant swing highs and the last 3 swing lows. It then places lines on the chart to highlight those levels.
For a full overview of the indicator and code commentary visit the backtest-rookies (.com) website.
Example
VDUB_BINARY_PRO_3NEW UPDATED BINARY PRO 3_V2 HERE -
VDUB_BINARY_PRO_3_V1 UPGRADE from binary PRO 1 / testing/ / experimental / Trade the curves / Highs -Lows / Band cross over/ Testing using heikin ashi
//Linear Regression Curve
//Centre band
//CM_Gann Swing HighLow V2/Modified////// MA input NOT WORKING ! - I broke it :s
//Vdub_Tetris_V2/ Modified
*Update Tip /Optional
Set the centre band to '34 to run centre line

RSI Chebyshev Pro with Goldilocks Fractals [NPR21]RSI Chebyshev Pro with Goldilocks Fractals
- Advanced RSI oscillator combining Chebyshev Type I filtering, MESA adaptive algorithms, candlestick pattern recognition, and Williams Fractal pivot detection for comprehensive momentum analysis.
Core Features:
RSI Calculation
- Chebyshev Type I filtering for superior noise reduction
MESA Adaptive Moving Average for automatic cycle detection
Four display modes: Candles, Candles with Patterns, Heikin Ashi, Line
Adjustable RSI (1-10) and MA (1-10) line widths
Gradient-colored adaptive MA
Pattern Recognition
- Bullish/Bearish Engulfing: Green/red triangles with "Eng" labels
- Morning Star: Green label with diamond and up arrow (bullish reversal)
- Evening Star: Red label with diamond and down arrow (bearish reversal)
- Patterns require RSI confirmation (>60 bearish, <40 bullish)
- Vertical dashed lines mark all pattern occurrences
Goldilocks Fractals
- Williams Fractal methodology applied to RSI values
- BUY signals at swing lows, SELL signals at swing highs
- Bright green/red arrows maintain size at all zoom levels
- Customizable periods (default: 5), offsets, colors, and sizes
- Independent toggles for labels and shapes
Visual Design
- Hollow green bullish candles, solid red bearish candles
- Reference lines at 30, 50, 70 levels
- Professional gradient coloring (orange→yellow→green)
- Optimized for both light and dark themes
How to Use
- Settings
- Length (24): RSI calculation period
- Smoothing (3): Chebyshev smoothing factor
- Fractal Periods (5): Pivot lookback - lower = faster, higher = reliable
- MA Multiplier (1): Cycle detection sensitivity
- Line Widths: Adjust RSI and MA thickness (1-10)
Trading Applications
- Scalping (1m-5m): Fractal n=2-3, quick reversals
- Day Trading (15m-1H): Fractal n=4-5, pattern confluence
- Swing Trading (4H-Daily): Fractal n=6-8, major pivots
- Best signals: Multiple confirmations (fractal + pattern + RSI extreme)
Signal Priority
- Fractal SELL + Evening Star + RSI >70 = Strong bearish
- Fractal BUY + Morning Star + RSI <30 = Strong bullish
- Engulfing + Fractal + MA direction = High probability
- Always confirm with price action on main chart
Technical Details:
Uses Chebyshev filters for minimal phase distortion and sharp noise cutoff. MESA algorithm detects dominant market cycles (1-2048 bars) for adaptive MA calculation. Patterns require multi-bar body analysis, trend context, and RSI level confirmation. Fractals use ta.pivothigh/pivotlow on RSI values with n-period offset to prevent repainting.
Performance
No repainting - fractals appear n bars after formation. Optimized calculations for multiple indicator use. Works on all timeframes and asset classes. Compatible with desktop and mobile platforms.
Credits;
Original RSI concept by ChartPrime. Chebyshev filtering from signal processing theory. MESA algorithm by John Ehlers. Williams Fractals by Bill Williams. Conversion and integration by NPR21.
License: Mozilla Public License 2.0
Disclaimer: For educational purposes only. Use proper risk management. Past performance does not guarantee future results.

BOS + CHoCH by EVThis indicator is designed to identify market structure shifts through Break of Structure (BOS) and Change of Character (CHoCH) using confirmed swing highs and lows. It provides a clear and objective way to read price structure by distinguishing between continuation moves and genuine directional changes.
BOS events represent structural continuation, occurring when price breaks a previous swing level in the direction of the prevailing bias. CHoCH events highlight potential trend reversals, triggering when price breaks a key level against the current structural bias. This distinction allows traders to better contextualize momentum, trend strength, and possible regime changes.
All calculations are based on confirmed pivots, ensuring the indicator is fully non-repainting and reliable in live market conditions. Break confirmation can be evaluated using candle closes or wicks, depending on user preference, and optional level lines can be drawn to visualize the exact structure point that was broken.

Gann Sacred Geometry Hexagram Ver 1.2━━━━━━━━━━━━━━━━━━━━━━━━━━━━━━━━━━━━━━━━
🔯 GANN SACRED GEOMETRY HEXAGRAM v1.2
━━━━━━━━━━━━━━━━━━━━━━━━━━━━━━━━━━━━━━━━
A comprehensive technical analysis tool combining W.D. Gann's sacred geometry principles,
hexagram patterns, and advanced confluence scoring for high-probability trade signals.
━━━━━━━━━━━━━━━━━━━━━━━━━━━━━━━━━━━━━━━━
📖 GANN THEORY BACKGROUND
━━━━━━━━━━━━━━━━━━━━━━━━━━━━━━━━━━━━━━━━
W.D. Gann (1878-1955) believed markets move in geometric patterns and that price
and time must be in balance. His methods incorporated:
- The Square of Nine
- Geometric angles (1x1, 2x1, etc.)
- Sacred geometry and natural law
- Cycle theory and time divisions
- The principle "When time and price square, a change in trend is imminent"
This indicator applies these timeless principles with modern confluence analysis.
SACRED GEOMETRY FOUNDATION:
The hexagram (six-pointed star) is formed by two overlapping equilateral triangles:
- ▲ Upward triangle = Yang energy, bullish forces, expansion
- ▼ Downward triangle = Yin energy, bearish forces, contraction
When overlapped, they create the "Star of David" - representing perfect balance
between opposing market forces. Gann believed this geometry revealed natural
support and resistance zones where price would react.
HEXAGRAM IN MARKETS:
- 6 outer points = Major reversal zones
- Center point = Balance/equilibrium price
- Inner intersections = Secondary support/resistance
- The shape itself creates "harmonic" price levels
GANN'S SQUARE PHILOSOPHY:
"When time and price square, a change in trend is imminent."
- W.D. Gann
This indicator applies the "squaring" concept:
1. SPATIAL SQUARE: Grid cells are perfect squares in price-time space
2. TEMPORAL SQUARE: Time divisions (1/4, 1/2, 3/4) create cycle points
3. PRICE SQUARE: Price divisions (25%, 50%, 75%) mirror time divisions
4. GEOMETRIC SQUARE: All geometry radiates from perfect square centers
When price reaches a corner or edge of a square at a time cycle point,
the "squaring" of price and time creates a reversal probability zone.
PHI IN GANN GEOMETRY:
The Golden Ratio appears throughout natural phenomena and market structure.
This script uses φ in two primary ways:
1. INNER TRIANGLE SCALING:
- Outer triangles span the full cell (100%)
- Inner triangles scaled by φ⁻¹ (0.618 or 61.8%)
- This creates Fibonacci retracement levels geometrically
2. HARMONIC RESONANCE:
- φ ratio divides price space into natural harmony
- Markets tend to pause/reverse at these φ-scaled levels
- Combines Fibonacci analysis with Gann geometry
MATHEMATICAL RELATIONSHIP:
Inner Triangle Height = Outer Height × 0.618
Inner Triangle Width = Outer Width × 0.618
These create the 61.8% retracement levels automatically
within each grid cell's geometry.
GANN'S COMPLETE ANGLE SYSTEM:
Gann identified 9 primary angles that price follows. Each represents a different
relationship between price movement and time passage:
╔════════════════════════════════════════════════════════════════╗
║ ANGLE │ RATIO │ DEGREES │ MEANING ║
╠════════════════════════════════════════════════════════════════╣
║ 1x8 │ 1:8 │ 7.125° │ Very slow trend (gentle) ║
║ 1x4 │ 1:4 │ 14.036° │ Slow trend ║
║ 1x3 │ 1:3 │ 18.435° │ Moderate-slow trend ║
║ 1x2 │ 1:2 │ 26.565° │ Moderate trend ║
║ 1x1 │ 1:1 │ 45.000° │ MASTER ANGLE (most important) ║
║ 2x1 │ 2:1 │ 63.435° │ Strong trend ║
║ 3x1 │ 3:1 │ 71.565° │ Very strong trend ║
║ 4x1 │ 4:1 │ 75.964° │ Extreme trend ║
║ 8x1 │ 8:1 │ 82.875° │ Parabolic trend (unsustainable)║
╚════════════════════════════════════════════════════════════════╝
THE 1x1 ANGLE - THE MASTER:
- Most important angle in Gann theory
- Represents perfect balance: 1 unit price = 1 unit time
- When price is ABOVE 1x1 = Bullish control
- When price is BELOW 1x1 = Bearish control
- Crossing 1x1 = Major trend change signal
ANGLE FANS:
- From any pivot point, all 9 angles radiate outward
- Creates a "fan" of dynamic support/resistance
- Steeper angles (4x1, 8x1) = strong momentum resistance
- Gentler angles (1x4, 1x8) = weak support in downtrends
THE SACRED DIVISIONS OF TIME:
Gann divided all cycles into 8 equal parts, based on ancient geometry
and astrological principles:
CYCLE DIVISIONS (8ths):
┌─────────────────────────────────────────────────────┐
│ 1/8 = 12.5% │ First minor turn point │
│ 2/8 = 25.0% │ First major turn (Cardinal) │
│ 3/8 = 37.5% │ Second minor turn │
│ 4/8 = 50.0% │ MID-CYCLE (most powerful) │
│ 5/8 = 62.5% │ Third minor turn │
│ 6/8 = 75.0% │ Second major turn (Cardinal) │
│ 7/8 = 87.5% │ Fourth minor turn │
│ 8/8 = 100.0% │ CYCLE COMPLETION (reversal zone) │
└─────────────────────────────────────────────────────┘
WHY EIGHTHS?
- 8 is the number of balance in sacred geometry
- Octave divisions create harmonic resonance
- 360° circle ÷ 8 = 45° (the 1x1 master angle)
- Natural cycles show 8-fold symmetry
IN THIS SCRIPT:
When current time position is within 8% of any eighth division,
the "Gann 8ths Timing" factor activates, adding confluence points.
THE CARDINAL CROSS SYSTEM:
The Cardinal Cross divides any square into four equal quadrants,
creating a cross pattern:
100% ●━━━━━━━━━━━━━●
┃ ↑ ┃
75% ┃ SELL ZONE ┃ ← Resistance quadrant
┃ ↑ ┃
50% ●━━━━━●━━━━━━● ← EQUILIBRIUM (most important)
┃ ↓ ┃
25% ┃ BUY ZONE ┃ ← Support quadrant
┃ ↓ ┃
0% ●━━━━━━━━━━━━━●
PRICE LEVELS:
- 0% = Bottom support (grid cell low)
- 25% = Lower mid-level support
- 50% = PERFECT BALANCE - most powerful level
- 75% = Upper mid-level resistance
- 100% = Top resistance (grid cell high)
TIME DIVISIONS:
- 0% = Cycle start (grid cell left edge)
- 25% = First quarter turn
- 50% = Mid-cycle (most powerful timing)
- 75% = Third quarter turn
- 100% = Cycle completion (grid cell right edge)
CONFLUENCE MAGIC:
When BOTH price AND time align at cardinal points simultaneously:
Example: Price at 50% level + Time at 50% of cycle = Maximum power
This is the "squaring" Gann referred to.
━━━━━━━━━━━━━━━━━━━━━━━━━━━━━━━━━━━━━━━━
📊 KEY FEATURES
━━━━━━━━━━━━━━━━━━━━━━━━━━━━━━━━━━━━━━━━
✅ Dynamic Grid System (1x1 to 7x7) - Automatically constructed from swing high to swing low
✅ Sacred Geometry Hexagrams - Overlapping triangles creating Star of David pattern
✅ Golden Ratio (φ = 1.618) Inner Triangles - Fibonacci harmony in geometry
✅ 9 Complete Gann Angles - 1x1, 2x1, 1x2, 3x1, 1x3, 4x1, 1x4, 8x1, 1x8
✅ Cardinal Cross Levels - 0%, 25%, 50%, 75%, 100% price divisions
✅ Gann 8ths Timing Cycles - 1/8, 1/4, 3/8, 1/2, 5/8, 3/4, 7/8 time divisions
✅ Price-Time Square Balance - Gann's principle of harmonious price-time relationship
✅ Advanced Confluence Scoring - Multi-factor signal validation (8-30 score range)
✅ Optimized Geometry Display - Shows full detail only near current price (reduces clutter)
✅ Customizable Visual Themes - Full color and thickness control
━━━━━━━━━━━━━━━━━━━━━━━━━━━━━━━━━━━━━━━━
🎯 HOW IT WORKS
━━━━━━━━━━━━━━━━━━━━━━━━━━━━━━━━━━━━━━━━
📍 GRID CONSTRUCTION:
The indicator identifies the most recent significant swing high-to-low movement using
configurable pivot periods (default: 88 bars). This creates the base "square" which is
then replicated in a grid pattern both vertically (price) and horizontally (time).
📐 SACRED GEOMETRY:
Each grid cell contains:
- Outer hexagram (Star of David) formed by two overlapping triangles
- Inner φ-ratio triangles scaled by the Golden Ratio
- Gann angles radiating from the center point
- Cardinal cross levels dividing price into quarters
🔍 CONFLUENCE SCORING SYSTEM:
Signals are generated when multiple Gann principles align:
1. Cardinal Cross Levels (0-6 points) - Price at key quarter divisions
2. Gann Angle Touches (0-5 points) - Price touching dynamic support/resistance angles
3. Angle Clustering (0-6 points) - Multiple angles converging = strong zone
4. Gann 8ths Timing (0-3 points) - At critical time cycle points
5. Price-Time Square (0-4 points) - Balanced price/time movement
6. Trend Alignment (0-3 points) - Signal direction matches trend
7. Grid Boundary Timing (0-3 points) - Near cell edges = reversal zones
8. φ Triangle Touches (0-2 points) - Golden ratio support/resistance
9. Reversal Patterns (0-2 points) - Wick rejections confirming reversal
Minimum confluence score of 15 required for signal (adjustable 8-30).
━━━━━━━━━━━━━━━━━━━━━━━━━━━━━━━━━━━━━━━━
⚙️ RECOMMENDED SETTINGS
━━━━━━━━━━━━━━━━━━━━━━━━━━━━━━━━━━━━━━━━
📊 For Daily Charts (Swing Trading):
- Gann Number: 88
- Grid Size: 4x4
- Confluence Score: 15
- Geometry Range: 5
- Trend Filter: ON
📊 For 4H Charts (Intraday):
- Gann Number: 44
- Grid Size: 3x3
- Confluence Score: 12-13
- Geometry Range: 3-4
- Trend Filter: ON
📊 For 15M Charts (Scalping):
- Gann Number: 22
- Grid Size: 2x2
- Confluence Score: 10-12
- Geometry Range: 2-3
- Allow Counter-Trend: Consider enabling
━━━━━━━━━━━━━━━━━━━━━━━━━━━━━━━━━━━━━━━━
📚 BEST PRACTICES
━━━━━━━━━━━━━━━━━━━━━━━━━━━━━━━━━━━━━━━━
✓ Use higher confluence scores (15+) for higher probability trades
✓ Combine with volume analysis for confirmation
✓ Respect trend filter - signals with trend are stronger
✓ Watch for signals at grid boundaries (time cycle completions)
✓ Higher scores (20+) indicate exceptional setups
✓ Use alerts to catch signals in real-time
✓ Works best on liquid markets with clear swings
EXAMPLE 1: Strong Buy Signal (Score: 18)
✓ Price touched 50% level (6 pts)
✓ 1x1 Gann angle support (5 pts)
✓ At Gann 8th cycle point (3 pts)
✓ Price-Time squared (4 pts)
= High probability long entry
EXAMPLE 2: Medium Sell Signal (Score: 15)
✓ Price at 75% level (4 pts)
✓ 2x1 angle resistance (3 pts)
✓ Trend aligned downward (3 pts)
✓ Near grid boundary (3 pts)
✓ Bearish wick rejection (2 pts)
= Valid short entry
━━━━━━━━━━━━━━━━━━━━━━━━━━━━━━━━━━━━━━━━
🎨 CUSTOMIZATION OPTIONS
━━━━━━━━━━━━━━━━━━━━━━━━━━━━━━━━━━━━━━━━
- Structure: Gann Number (11, 22, 44, 88, 176, 352)
- Grid: Size from 1x1 to 7x7
- Geometry: Toggle squares, triangles, angles, levels
- Optimization: Show geometry only near price (performance boost)
- Thickness: All line widths adjustable (1-5)
- Colors: Full color customization for all elements
- Scoring: Adjust all tolerance and threshold parameters
- Timing: Enable/disable Gann 8ths, Price-Time Square
- Filters: Trend filter, boundary requirement, counter-trend signals
- Display: 4 signal styles (Labels, Diamonds, Circles, Stars)
━━━━━━━━━━━━━━━━━━━━━━━━━━━━━━━━━━━━━━━━
⚠️ IMPORTANT NOTES
━━━━━━━━━━━━━━━━━━━━━━━━━━━━━━━━━━━━━━━━
- This indicator is for educational purposes
- Not financial advice - always do your own research
- Past performance does not guarantee future results
- Use proper risk management and position sizing
- Combine with other analysis methods for best results
- Grid redraws when new swing high/low forms
- Signals appear in real-time based on confluence scoring
━━━━━━━━━━━━━━━━━━━━━━━━━━━━━━━━━━━━━━━━
📞 SUPPORT & UPDATES
━━━━━━━━━━━━━━━━━━━━━━━━━━━━━━━━━━━━━━━━
Follow for updates and improvements. Feedback welcome!
Version 1.2 - January 2025
- Optimized geometry rendering
- Enhanced confluence scoring
- Improved visual clarity
- Performance optimizations
━━━━━━━━━━━━━━━━━━━━━━━━━━━━━━━━━━━━━━━━

The Cantillon Liquidity Trap [SFP] - PRORetail traders chase breakouts. Institutions engineer traps."
The Problem: How often do you see price break a key High/Low, trigger your stop loss, and then immediately reverse in the other direction? This is not bad luck. This is a Liquidity Grab (Swing Failure Pattern). Institutions need your stop orders to fill their large positions. Once they are filled, the market reverses.
How This Tool Helps: The Cantillon Liquidity Trap automatically detects these manipulation points in real-time. It does not just look for "wicks"—it uses a strict institutional algorithm to identify:
Major Pivot Points: (Where the stops are hiding).
The Sweep: (The stop run).
The Failure: (Price closing back inside the range).
Volume Confirmation: (Smart money absorption).
The Signals:
🟥 TRAP (Bearish): A Swing High was swept, but buyers failed to hold. Look for Shorts.
🟩 GRAB (Bullish): A Swing Low was swept, but sellers were absorbed. Look for Longs.
🚀 How to Trade This (The Strategy): This tool provides the "WHEN" (The Trigger). To get the highest win rate, you must combine it with the "WHERE" (The Level).
Optimum Setup: Wait for a "TRAP" signal that aligns perfectly with a Volume Shelf or AVWAP. When "Time" (SFP) meets "Location" (Cantillon Level), you have an A+ Institutional Setup.
This is optimized for 4H, but feel free to play with it.
👇 Works best together with my "the cantillon overlay" signature below.

TBSTurtle Soup Body Pattern
The Turtle Soup Body is a price action pattern derived from the classic Turtle Soup setup, designed to identify false breakouts beyond recent highs or lows, with a strong emphasis on the candle body close.
This pattern occurs when price briefly breaks above a recent swing high (or below a recent swing low), triggering breakout traders, but then fails to sustain the move. Instead of focusing only on wicks, the Turtle Soup Body setup requires the candle body to close back inside the previous range, signaling rejection and loss of breakout momentum.
Key characteristics of the Turtle Soup Body pattern include:
A clearly defined recent high or low (typically a 20-period high/low)
Price breaks the level intraday, creating a false breakout
The candle body closes back below the high (for short setups) or above the low (for long setups)
Confirmation that market participants are trapped on the wrong side of the move
The Turtle Soup Body pattern is commonly used as a mean-reversion or reversal setup, offering tight stop-loss placement and favorable risk–reward ratios. It is especially effective in ranging or overextended market conditions and can be applied across multiple timeframes in the Forex market.

Apex Adaptive Trend Navigator [Pineify]Apex Adaptive Trend Navigator
The Apex Adaptive Trend Navigator is a comprehensive trend-following indicator that combines adaptive moving average technology, dynamic volatility bands, and market structure analysis into a single, cohesive trading tool. Designed for traders who want to identify trend direction with precision while filtering out market noise, this indicator adapts its sensitivity based on real-time market efficiency calculations.
Key Features
Adaptive Moving Average with efficiency-based smoothing factor
Dynamic ATR-based volatility bands that expand and contract with market conditions
Market Structure detection including BOS (Break of Structure) and CHoCH (Change of Character)
Real-time performance dashboard displaying trend status and efficiency metrics
Color-coded cloud visualization for intuitive trend identification
How It Works
The core of this indicator is built on an Adaptive Moving Average that uses a unique efficiency-based calculation method inspired by the Kaufman Adaptive Moving Average (KAMA) and TRAMA concepts. The efficiency ratio measures the directional movement of price relative to total price movement over the lookback period:
Efficiency = |Price Change over N periods| / Sum of |Individual Bar Changes|
This ratio ranges from 0 to 1, where values closer to 1 indicate a strong trending market with minimal noise, and values closer to 0 indicate choppy, sideways conditions. The smoothing factor is then squared to penalize noisy markets more aggressively, causing the adaptive line to flatten during consolidation and respond quickly during strong trends.
The Dynamic Volatility Bands are calculated using the Average True Range (ATR) multiplied by a user-defined factor. These bands create a channel around the adaptive moving average, helping traders visualize the current volatility regime and potential support/resistance zones.
Trading Ideas and Insights
When price stays above the adaptive line with the bullish cloud forming, consider this a confirmation of uptrend strength
The efficiency percentage in the dashboard indicates trend quality - higher values suggest more reliable trends
Watch for price interactions with the upper and lower bands as potential reversal or continuation zones
A flat adaptive line indicates consolidation - wait for a clear directional break before entering trades
How Multiple Indicators Work Together
This indicator integrates three complementary analytical approaches:
The Adaptive Moving Average serves as the trend backbone, providing a dynamic centerline that automatically adjusts to market conditions. Unlike fixed-period moving averages, it reduces lag during trends while minimizing whipsaws during ranging markets.
The ATR Volatility Bands work in conjunction with the adaptive MA to create a volatility envelope. When the adaptive line is trending and price remains within the cloud (between the MA and outer band), this confirms trend strength. Price breaking through the opposite band may signal exhaustion or reversal.
The Market Structure Analysis using swing point detection adds a Smart Money Concepts (SMC) layer. BOS signals indicate trend continuation when price breaks previous swing highs in uptrends or swing lows in downtrends. CHoCH signals warn of potential reversals when the structure shifts against the prevailing trend.
Unique Aspects
The squared efficiency factor creates a non-linear response that dramatically reduces noise sensitivity
Cloud fills only appear on the trend side, providing clear visual distinction between bullish and bearish regimes
The integrated dashboard eliminates the need to switch between multiple indicators for trend assessment
Pivot-based swing detection ensures accurate market structure identification
How to Use
Add the indicator to your chart and adjust the Lookback Period based on your trading timeframe (shorter for scalping, longer for swing trading)
Monitor the cloud color - green clouds indicate bullish conditions, red clouds indicate bearish conditions
Use the efficiency reading in the dashboard to gauge trend reliability before entering positions
Consider entries when price pulls back to the adaptive line during strong trends (high efficiency)
Use the volatility bands as dynamic take-profit or stop-loss reference levels
Customization
Lookback Period : Controls the sensitivity of trend detection and swing point identification (default: 20)
Volatility Multiplier : Adjusts the width of the ATR bands (default: 2.0)
Show Market Structure : Toggle visibility of BOS and CHoCH labels
Show Performance Dashboard : Toggle the trend status table
Color Settings : Customize bullish, bearish, and neutral colors to match your chart theme
Conclusion
The Apex Adaptive Trend Navigator offers traders a sophisticated yet intuitive approach to trend analysis. By combining adaptive smoothing technology with volatility measurement and market structure concepts, it provides multiple layers of confirmation for trading decisions. Whether you are a day trader seeking quick trend identification or a swing trader looking for reliable trend-following signals, this indicator adapts to your market conditions and trading style. The efficiency-based calculations ensure you always know not just the trend direction, but also the quality and reliability of that trend.

Asian Stop Hunt ModelSTOP HUNT MODEL – STRATEGY DESCRIPTION
The Stop Hunt Model is designed to capture high-probability trades by targeting stop-loss liquidity from retail traders at buy-side and sell-side liquidity zones. The strategy focuses on identifying where liquidity is taken during the Asian session, waiting for a Change of Character (CHoCH), and then entering from unfilled orders (Balanced Price Range / Imbalance) in the direction of the dominant IPDA bias. The objective is to trade from engineered liquidity sweeps toward the next logical liquidity pool, while maintaining strict risk control.
The model operates primarily on the 5-minute chart, with early confirmation on the 3-minute chart. The Asian Killzone is used to define the initial range, plotting its high and low. Higher-timeframe liquidity from Daily, 4H, and 1H charts is marked in advance to provide directional context. IPDA direction is determined using macro alignment such as global interest rate bias and long-term trend behavior.
Once the Asian session concludes, price is expected to sweep either the high or low of the Asian range or the previous day’s high/low. After the liquidity sweep, the market must show a valid CHoCH, confirming a shift in internal structure. Entries are taken only after the formation and retest of a Balanced Price Range (BPR) created by overlapping imbalances. Trades are executed from these imbalance zones, targeting the next liquidity area, with stop loss placed at the most recent swing high or low.
This model prioritizes precision over frequency, aiming for fewer trades with higher reward-to-risk ratios, typically 1:3 or better, and a strict daily risk cap.
CHECKLIST – STOP HUNT MODEL
1.Mark Asian Killzone High and Low
2.Identify IPDA directional bias for the pair
3.Mark Buy-side and Sell-side liquidity from Daily, 4H, and 1H
4.Wait for a liquidity sweep (Asian High/Low or Previous Day High/Low)
5.Confirm a valid CHoCH
6.Identify a valid BPR (overlapping imbalance)
7.Enter trade from the BPR zone
8.Target the next liquidity pool
9.Place stop loss at the last swing high or low
RULES – STOP HUNT MODEL STRATEGY
> Always pre-mark Buy-side and Sell-side liquidity on 1D, 4H, and 1H
> Asian Killzone must complete by 10:30 AM IST
> After Asian close, mark 15-minute timeframe liquidity
> Trade only after the market sweeps the Asian session high or low
> Align trades with IPDA direction:
> Bullish IPDA → Prefer sweep of Asian Low
> Bearish IPDA → Prefer sweep of Asian High
> CHoCH confirmation is mandatory:
> Green CHoCH for bullish setups
> Red CHoCH for bearish setups
Setup conditions:
1. Bullish: CHoCH above price + BPR below price
2. Bearish: CHoCH below price + BPR above price
3.BPR must be formed by overlapping imbalances:
4.Red → Green for bullish
5.Green → Red for bearish
6.Look for V-shaped (bullish) or A-shaped (bearish) candle behavior
7.Entry only on imbalance retest — no chase entries
8.Targets must be killzone extremes or next liquidity zone
9.Stop loss must always be at the last swing high or low
10.No manual exits if aiming for 1:3 RR
11.If price sweeps both sides or no clean sweep occurs → No Trade
12.Trade less, execute cleaner setups
13.Daily target: 1% maximum

Combined Advanced Trading BlueprintCombined Advanced Trading Blueprint
This all-in-one institutional trading suite integrates market structure, volume analysis, and automated target projection. It is designed to find high-probability "Blueprints" by combining PVSRA (Price, Volume, Storage, Resistance, and Support) with dynamic Fibonacci and ATR-based risk management.
🚀 Key Modules
1. Institutional Inflection Zones (Supply & Demand)
Identifies where major market participants are entering.
Supply & Demand: Automatically draws zones at key swing highs and lows.
IZ (Inflection Zones): Real-time labels marking the median of these zones.
BOS (Break of Structure): When a zone is breached, it transforms into a BOS line to signal trend continuation or reversal.
2. PVSRA & Vector Zones
The core of institutional volume analysis.
Climax Volume (Red/Green): Bars with volume >= 200% of average. These mark exhaustion or massive entry.
High Volume (Violet/Blue): Bars with volume >= 150% of average.
Automated Zones: The script draws boxes around these high-volume candles. Price returning to these zones often sees a sharp reaction.
3. Trader Daddy Intelligence
An automated layer for objective target setting.
Auto-Fibonacci: Dynamically calculates the current swing range and plots 0.236, 0.382, 0.5, 0.618 (Golden), 0.786, and extensions.
Volume Gaps (FVG): Detects Fair Value Gaps (FVGs) where price moved too fast. These acts as "magnets" that the market usually returns to fill.
ATR Targets: Dynamic Take Profit (TP1, TP2, TP3) and Stop Loss (SL) lines that adjust based on current market volatility.
4. Confluence Ribbon System
A multi-layered moving average and channel system.
The Ribbon: Uses 8 EMA (Red), 21 EMA (White), 34 EMA (Blue), 50 SMA (Orange), and 200 SMA (Dark Orange).
Keltner Channels: Three standard deviation bands to identify overbought/oversold conditions.
RSI Triggers: A fast 2-period RSI detects "stretches" outside the Keltner bands for precise entry timing.
VWAP: Includes anchored VWAP for Session, Weekly, and Monthly trends.
🎨 Visual Guide & Color Legend
Price Targets (Trader Daddy)
Green Dashed Lines: Take Profit levels (TP1, TP2, TP3).
Red Solid Line: ATR-based Stop Loss.
Cyan/Blue Labels: Fibonacci retracement levels. The Blue level often acts as a major institutional target or "Take Profit" area in a trending market.
Market Zones
Cyan Boxes: Active Demand (Buy) zones.
Grey/White Boxes: Active Supply (Sell) zones.
Purple/Fuchsia Areas: Vector Zones (High institutional volume).
🛠 How to Trade the Blueprint
Locate the Zone: Wait for price to enter a Supply/Demand box or a Purple Vector Zone.
Check the Market State: Look at the top-right info label to see if the trend is Bullish, Bearish, or Neutral.
Wait for Confluence: Look for an 8/21 EMA crossover or an RSI "Circle" trigger near the Keltner bands.
Execute: Use the ATR-generated TP and SL lines to manage your risk automatically.

W/D/4HR OTE Aligner (V6) - Alerts This indicator is a multi-timeframe (MTF) alignment and Optimal Trade Entry (OTE) alert tool designed for discretionary manual trading on the 15-minute timeframe.
Here is a description of its core functionality:
W/D/4HR OTE Aligner (V6) - Alerts
This custom TradingView indicator assists manual traders by identifying high-probability trading setups that meet specific structural and momentum criteria across multiple timeframes. It does not place trades automatically but generates a "Trade Signal" used for setting up reliable alerts.
Key Features:
Multi-Timeframe Bias Confirmation: The indicator uses a 50-period Exponential Moving Average (EMA) to confirm that the Weekly, Daily, and 4-Hour timeframes are all aligned in the same direction (all above for bullish, all below for bearish). This provides a strong directional bias.
OTE Zone Identification: It dynamically calculates recent swing highs and lows on the 4-hour chart (using reliable pivot detection) and highlights the Optimal Trade Entry (OTE) zone, typically centered around the 0.618 Fibonacci Retracement level.
15-Minute Entry Signal: Once price enters the OTE zone within the aligned trend direction, the indicator looks for a confirmation entry signal on the 15-minute chart, specifically a 9-period EMA crossing the 20-period EMA.
Manual Alert System: A transparent "Trade Signal" plot provides the trigger source for a manual TradingView alert, notifying the user exactly when all criteria are met for a potential long or short trade entry.
This indicator is a tool for finding precise entry points within dominant, confirmed trends.
for clarity i built this using Google AI to help with being away from the charts it reflects how i wish to progress on my journey so any tips or feed back with me much appreciated

[PickMyTrade] Trend strategy for LongThis strategy detects descending trend resistance using pivot-based trendlines and enters long positions when price confirms a breakout above a validated trendline. It is designed to capture bullish trend reversals with strict risk control and flexible exit management.
The system focuses on structural market behavior rather than indicators, making it suitable for traders who prefer price-action-based decision making.
USAGE
This strategy automatically builds trendlines from confirmed pivot highs. A trendline is considered valid only when price has interacted with it a user-defined number of times, ensuring that trades are taken only from well-formed market structures.
A trade is triggered when price closes above a validated descending trendline while optional session and position limits are respected.
All risk and position sizing are calculated automatically based on the selected risk amount and stop-loss distance.
HOW IT WORKS
The strategy identifies swing highs using pivot logic and connects them into descending trendlines. Each trendline must meet a minimum number of touch confirmations before becoming eligible for trading.
When price closes above a valid trendline, the strategy calculates:
Stop-loss placement below the most recent pivot low
Position size based on fixed monetary risk
Profit targets based on the selected exit method
EXIT METHODS
Three exit models are supported:
Risk–Reward Ratio
Uses a fixed multiple of the defined risk distance to set the take-profit level.
Lookback Candle Exit
Exits trades when price shows structural reversal behavior based on recent candles.
Fibonacci Targets
Uses Fibonacci extensions derived from recent swing structure to trail profits dynamically.
An optional trailing stop can also be enabled to protect open profits.
FEATURES
Automatic pivot-based trendline detection
Multi-trendline or single-trendline operation
Dynamic position sizing based on monetary risk
Pivot-based stop-loss placement
Multiple exit methodologies
Optional trailing stop
Optional trading session filter
Fully visualized trendlines, stop levels, and profit targets
SETTINGS
Trend Detection
Pivot Length for Trend
Touch Number
Validation Percentage
Optional Pivot-to-Pivot Confirmation
Risk Management
Fixed Risk Amount
Default Contract Size Option
Stop-Loss Buffer
Trailing Stop Toggle
Take-Profit
Exit Method Selection
Risk-Reward Ratio
Lookback Candle Length
Fibonacci Extension Levels
Session Filter
Enable/Disable Session Trading
Trading Session Time Window

Liquidity Sweep of Candle & Swing @MaxMaserati 3.0MMM Liquidity Sweep Detector for single candle sweep and/or Swing Sweep
Identify liquidity sweeps with precision. A sweep occurs when price wicks through a key level (previous candle high/low or swing point) but closes back inside the range - indicating a failed breakout and potential reversal.
The set includes: Sweep Low, 50% of wick, TGT level
KEY FEATURES:
- Two Detection Modes: Track sweeps on previous candle levels OR swing highs/lows (pivot points)
- Both Mode: View candle and swing sweeps simultaneously
- Visual Clarity: Each sweep displays three extending lines (SWH/SWL, Target, 50% wick), box zone, and swept level with red X marker
- Smart Updates: When price creates new sweep levels without hitting targets, the entire sweep structure automatically relocates to the new level
- Double-Sided Logic: When both sides are swept on one candle, the indicator intelligently places the sweep on the longest wick side
SWEEP DEFINITION:
Bullish Sweep: Price wicks BELOW a low but closes ABOVE it (back inside range)
Bearish Sweep: Price wicks ABOVE a high but closes BELOW it (back inside range)
The indicator only creates sweeps on unviolated levels - levels that haven't been closed through yet. This ensures you're trading genuine liquidity sweeps, not broken levels.
CUSTOMIZATION:
- Adjustable swing lookback period
- Multiple box placement options
- Full color and display controls
- Invalidation options (Sweep High/Low or 50% Wick)
- Statistics panel showing active sweeps and completion rates
Perfect for traders using ICT concepts, Smart Money Theory, or institutional order flow analysis. Identify where large players are hunting liquidity before reversing price.
⚠️ DISCLAIMER
Educational Tool Only - This indicator is for educational and informational purposes only and does not constitute financial, investment, or trading advice.
Risk Warning - Trading involves substantial risk of loss and is not suitable for all investors. Past performance does not guarantee future results. No representation is made that this indicator will achieve profits or prevent losses.
User Responsibility - All trading decisions are solely your responsibility. The developer and Max Maserati Model assume no liability for losses incurred from using this indicator. Conduct your own research and consult a qualified financial advisor before making investment decisions.
By using this indicator, you acknowledge and agree to these terms.

EMA 21 Pullback - Swing Break (Single Signal)EMA 21 Pullback Swing Break – Single Entry Indicator
This indicator is designed for traders who prefer clean, structure-based entries
instead of frequent signals.
LOGIC:
1. EMA 21 defines the trend direction.
2. Price must pull back to EMA 21 (mandatory).
3. After pullback, an internal swing is formed.
4. Entry signal is generated only when that swing is broken.
5. Only ONE signal is allowed per EMA pullback.
6. Next signal appears only after price touches EMA again.
BUY CONDITIONS:
- Price above EMA 21
- Pullback to EMA 21
- Internal swing high formed after pullback
- Candle closes above that swing high
SELL CONDITIONS:
- Price below EMA 21
- Pullback to EMA 21
- Internal swing low formed after pullback
- Candle closes below that swing low
FEATURES:
✔ No repaint
✔ Structure-based entries
✔ Single signal per pullback
✔ Works best in trending markets
✔ Avoids sideways noise
BEST USE:
- Index trading (NIFTY, BANKNIFTY, SENSEX)
- Timeframes: 3m, 5m, 15m
- Combine with price action or higher timeframe trend
DISCLAIMER:
This indicator is for educational purposes only.
Always use proper risk management.

Quantum Flow [JOAT]Quantum Flow Nexus - Advanced Multi-Dimensional Flow Analysis
Overview
Quantum Flow Nexus is an open-source overlay indicator that combines custom EMA-based flow calculations with order flow analysis, multi-timeframe correlation, and liquidity zone detection. It provides traders with a structured framework for analyzing market momentum and identifying potential entry points based on multiple confirming factors.
What This Indicator Does
The indicator calculates several analytical components:
Quantum Flow Oscillator - A custom oscillator built from multiple EMA layers at different depths
Flow Momentum - Rate of change of the flow oscillator
Order Flow Delta - Buy vs sell volume pressure estimation
Smart Money Index - Volume-weighted directional bias metric
Multi-Timeframe Entanglement - Price correlation across 15m and 60m timeframes
Liquidity Zones - Historical swing high/low levels with volume significance
Wave Function State - Momentum-based decisiveness detection
How It Works
The core quantum oscillator uses a custom EMA calculation with depth layering:
quantumOscillator(series float src, simple int len, simple int depth) =>
float osc = 0.0
for i = 1 to depth
int fastLen = len / i
int slowLen = len * i
float emaFast = quantumEMA(src, fastLen)
float emaSlow = quantumEMA(src, slowLen)
osc += (emaFast - emaSlow) / depth
osc
This creates a multi-layered view of momentum by comparing EMAs at progressively different speeds.
Signal Generation
Basic signals occur when:
Bullish: Flow crosses above lower band + positive momentum + positive order flow delta
Bearish: Flow crosses below upper band + negative momentum + negative order flow delta
Strong signals require additional confirmation:
Smart Money Index above/below threshold (50/-50)
Entanglement score above 50%
Wave function in collapsed state (decisive momentum)
Confluence Score Calculation
The indicator combines multiple factors into a single confluence percentage:
float confluenceScore = (flowStrength * 20 + entanglementScore * 0.3 + math.abs(orderFlowDelta) * 0.5) / 3
Dashboard Panel (Top-Right)
Flow Strength - Distance from center line normalized by standard deviation
Momentum - Current rate of change of flow
Trend - BULLISH/BEARISH/NEUTRAL based on flow vs EMA
Confluence Score - Combined factor percentage
Order Flow Delta - Buy/sell pressure percentage
Entanglement - Multi-timeframe correlation score
Wave State - COLLAPSED or SUPERPOSITION
Signal - Current actionable status
Visual Elements
Flow Lines - Center flow line with upper/lower bands
Quantum Zones - Filled areas between bands showing bullish/bearish zones
3D Quantum Field - Five oscillating layers creating depth visualization
Order Flow Blocks - Boxes highlighting significant order flow imbalances
Liquidity Heatmap - Dashed lines at significant historical levels
Signal Markers - Triangles for basic signals, labels for strong signals
Input Parameters
Flow Period (default: 21) - Base period for flow calculations
Quantum Depth (default: 3) - Number of EMA layers
Sensitivity (default: 1.5) - Band width multiplier
Liquidity Max Levels (default: 8) - Maximum liquidity zones displayed
Liquidity Min Strength Ratio (default: 0.10) - Minimum volume significance
Suggested Use Cases
Identify momentum direction using flow oscillator position
Confirm entries with order flow and smart money readings
Use liquidity zones as potential support/resistance areas
Wait for strong signals with multiple factor confirmation
Timeframe Recommendations
Effective on 15m to Daily charts. Lower timeframes may produce more signals with higher noise levels.
Limitations
Order flow is estimated from candle structure, not actual order book data
Multi-timeframe requests add processing time
Liquidity zones are based on historical pivots and may not reflect current market structure
Open-Source and Disclaimer
This script is published as open-source under the Mozilla Public License 2.0 for educational purposes. It does not constitute financial advice. Past performance does not guarantee future results. Always use proper risk management.
- Made with passion by officialjackofalltrades
